GPC Principle
We promise to support our clients with various organic/inorganic material R&Ds with utmost sincerity.
GPC (Gel Permeation Chromatography) is a chromatography technique that allows polymers to be separated according to their molecular size as the polymer solution permeates through a particular column (packed with crosslinked gel).
To simplify, it follows the principle of large molecules elute first and small molecules elute later, and thus if we measure the residence time of polymer (retention time) in column, we can calculate the molecular weight of a polymer. The term SEC (size exclusion chromatography) is synonymous with GPC as it segregates polymers based on their size. Out of a myriad of methods to measure the molecular weight of molecules (GC/Mass, LC/Mass, MALDI-TOF, etc.), GPC is the most standard technique to quantify relative molecular weight of a polymer.
General GPC System (All-in-one)
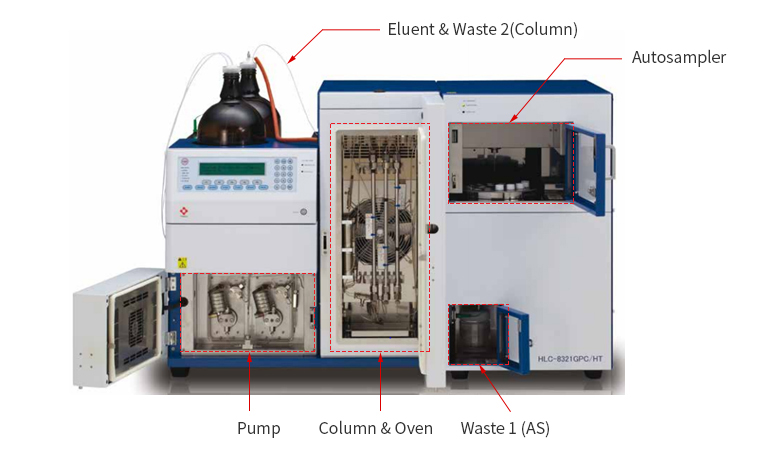
Fig 1. Typical GPC System (Tosoh EcoSEC SEC/GPC System brochure)
Schematic diagram of a general GPC system
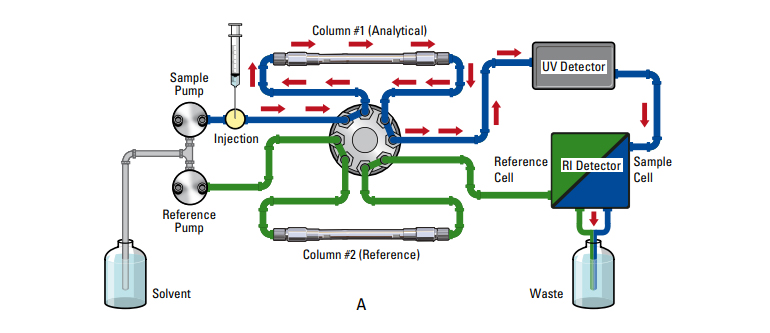
Fig 2. Typical GPC System Scheme (Tosoh EcoSEC SEC/GPC System brochure)
GPC consists of pump, injector, column, detector, data system, just like other ordinary HPLC systems. The following table arranged the difference between HPLC and GPC. The most notable difference of the two is that HPLC utilizes the difference in polarity to separate, while GPC has an integrated GPC column that segregates based on the size. The general HPLC typically detects UV, while GPC commonly use Refractive Index (RI) detector. The GPC testing room should always maintain a constant temperature due to the refractive index's high sensitivity to temperature. Because of thermal sensitivity, All-in-One GPC system is more advantageous in stabilizing the refractive index detector rather than a modular type GPC since it is much easier to control the temperature of the instrument. In the case of polymers with low refractive index signal, we often use ELSD (evaporative light scattering detector) to measure its molecular weight.
Difference between HPLC and GPC
| HPLC | GPC | |
| Separation Principle | Polarity | Size exclusion |
| Eluent | Water, methanol, acetonitrile, etc. | Water, THF, DMF, CHCl3, TCB, etc. |
| Column packing material | C18 silica beads | Porous polymeric beads |
| Detector | UV(mainly), RI, ELSD, MS | RI(mainly), UV, ELSD, LALS, MALS |
| Standards | High purity molecules with known concentration | PS, PMMA, PEG/PEO, Polysaccharides, etc with known molecular weight |
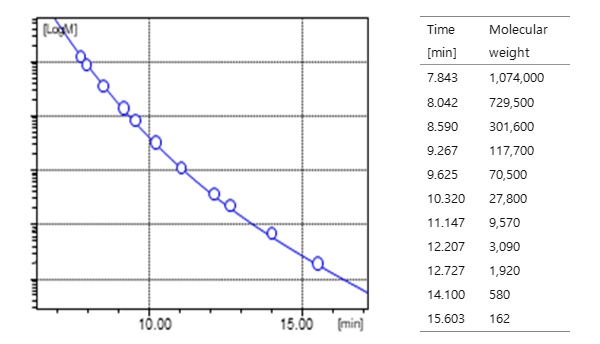
How would we find out the molecular weight of an unknown test sample? To answer this question, calibration must be performed with multiple polymer standards with known molecular weight. For example, if we analyze nine polymer standards with different molecular weights on GPC, it would yield a chromatogram with nine peaks, just like the chromatogram below. If we plot the graph with retention time vs. molecular weight based on the chromatogram, it shows a linear or quadratic trend. We call this graph as calibration plot or calibration curve. When we analyze a polymer with unknown molecular weight with GPC, the molecular weight of the polymer can be calculated based on the calibration curve according to their retention time. GPC standards are polymers that are manufactured through particular ionic polymerization to minimize the polymer distribution (near monodisperse).
Typically, Polystyrene and PMMA standards are used for organic solvent eluent, and polyethylene glycol and polysaccharide standards are used for aqueous eluent. One must note that molecular weight measured in GPC is a relative molecular weight in respect to the polymer standards, and it is not an absolute or true molecular weight of a polymer.
Drawing Calibration plot from polymer standard chromatogram

Method to interpret the results from GPC
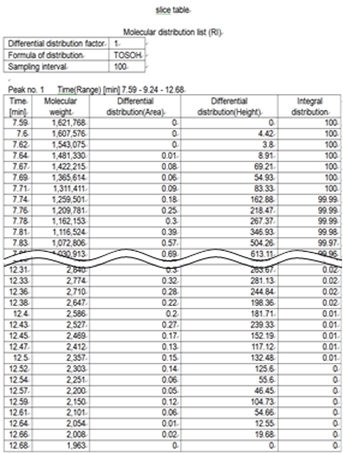
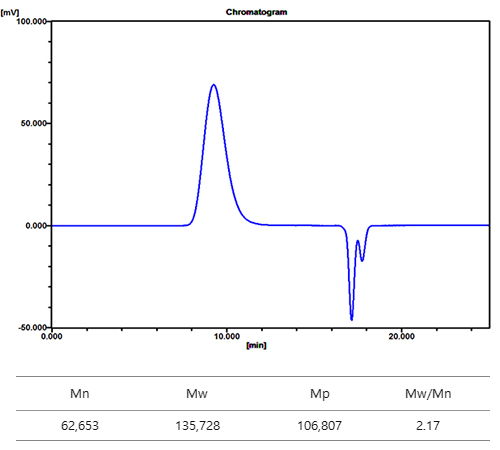
The data below is a GPC analysis of a PVC (Poly (vinyl chloride)) sample, an exemplary data from Koptri archives. Chromatogram is always shown in the form of retention time vs mV (millivolts, signal intensity). Chromatogram with 11 peaks could be acquired by using 11 polystyrene standards with a molecular weight of 162~1,074,000 Da. Negative peaks around 18 minute are called system peaks which are peaks from moisture, air, and air bubbles in solvent/sample. The calibration curve was drawn from this chromatogram, and the chromatogram with Gaussian distribution was obtained from GPC analysis of the PVC sample. The molecular weight of PVC was calculated based on the calibration curve, which resulted in number-average molecular weight (Mn) as 62,653 g/mol, and weight-average molecular weight (Mw) as 135,728 g/mol. Slice table can be seen as a raw data table for GPC result. Small organic molecules have a single molecular weight, but polymer has a distribution of molecular weight, making it essential to comprehend the concept of average molecular weight. Please refer to "Concept of Average molecular weight” in our website.
Chromatogram of Polystyrene Standards

Polystyrene Standard Calibration curve
Chromatogram and molecular weight result of Poly(vinyl chloride)
Slice table of Poly(vinyl chloride)
